Community Modeling and Analysis System
Statistical and Graphical Analysis Tools
RegisterThe CMAS Center now offers an advanced training series for air quality modelers titled "Evaluating Air Quality Model Performance". The series will consist of modules highlighting various analysis tools and methods to understand model performance, and better inform air quality decision-making.
Availability
The table below lists the dates of the upcoming Statistical and Graphical Analysis Tools classes along with the enrollment status in each class. When enrollment is full (15 registered students) we will no longer accept applications for the class and the status column in the table will display that the class is full.
The class is subject to cancellation if there are not enough registered students. A minimum of 6 trainees must be registered to conduct a training.
The Interpretive Analysis course can also be conducted off site, provided that appropriate facilities are available and there are an adequate number of interested students. Email cmas@unc.edu to inquire about off-site trainings.
| Dates | Status | Space Left | Price | |
|---|---|---|---|---|
| No classes currently scheduled. Check back soon! | ||||
Please note: If you are interested in another training date, please contact CMAS support (e-mail at bottom of this page).
Objectives
Enable air quality modelers to become more proficient in:
- understanding model behavior
- identifying potential problems in model inputs or process formulations
- devising solutions to improve model performance
Audience
Beginning and intermediate-level modelers
Format of Module I: Statistical and Graphical Analysis Tools
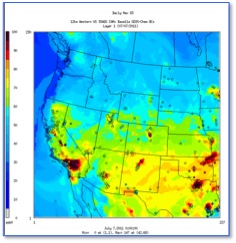
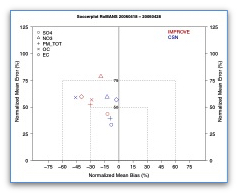
Two days of training combining lectures and hands-on example exercises using the Atmospheric Model Evaluation Tool (AMET) and the Visualization Environment for Rich Data Interpretation (VERDI) to quantitatively and qualitatively analyze model results. The last half of the second day will take students through the combined use of these tools in a self-paced exercise on evaluating air quality model performance in the simulation of a nitrogen deposition episode during the Rocky Mountain Atmospheric Nitrogen and Sulfur (RoMANS) observational campaign period in Spring 2006.
Agenda
| Time | Day 1 | Day 2 |
|---|---|---|
| 8:30 AM | Introductions, logistics, course overview and objectives | Graphical Analysis: Introduction to VERDI |
| 8:45 AM | ||
| 9:00 AM | Concepts of air quality model evaluation | VERDI setup and running |
| 9:15 AM | Load datasets in VERDI | |
| 9:30 AM | Create formulas in VERDI | |
| 9:45 AM | Create plots in VERDI | |
| 10:00 AM | Break 10:00 - 10:15 AM | Break 10:00 - 10:15 AM |
| 10:15 AM | Statistical Analysis: Introduction to AMET | Plot menu bar options to configure plots |
| 10:30 AM | AMET overview and directory structure | 10:45 AM | Load Shape files in VERDI and Areal Interpolation |
| 11:00 AM | Database initialization and hands-on exercise | |
| 11:15 AM | Scripting in VERDI | |
| 11:30 AM | Model output processing using the combine utility; hands-on exercise | |
| 11:45 AM | Questions | |
| 12:00 PM | Lunch 12:00 - 1:00 PM | Lunch 12:00 - 1:00 PM |
| 12:15PM | ||
| 12:30 PM | ||
| 12:45 PM | ||
| 1:00 PM | Data matching: sitecmp and cmpairs | Self-paced exercise overview and objectives |
| 1:15 PM | ||
| 1:30 PM | Data load step and hands-on exercise | Prepare CMAQ data, download obs data, and run AMET |
| 1:45 PM | ||
| 2:00 PM | Tile plots, time series plots | |
| 2:15 PM | Analyze statistical performance metrics | |
| 2:30 PM | Hands-on exercises | |
| 2:45 PM | ||
| 3:00 PM | Break 3:00 - 3:15 PM | Break 3:00 - 3:15 PM |
| 3:15 PM | Bar plots and box plots | Compare statistical performance side-by-side with graphical analyses, and prepare summary |
| 3:30 PM | ||
| 3:45 PM | Scatter plots | |
| 4:00 PM | Individual or group presentations by students | |
| 4:15 PM | Soccer and bugle plots | |
| 4:30 PM | ||
| 4:45 PM | Hands-on exercises | Discussion/critique of analyses |
| 5:00 PM | ||
| 5:15 PM | Questions: 5:15-5:30 PM | Course evaluation and certificates 5:15-5:30 PM |
| 5:30 PM | END OF DAY 1 | ADJOURN |
Meet the Trainers

Liz Adams, MS Research Associate, Center for Environmental Modeling for Policy Development
Ms. Adams has over 10 years of experience in model applications, model evaluation, and debugging support to developers of air quality modeling systems. Ms. Adams prepares model documentation, and performs web-based software management, software installation and testing across multiple platforms (Linux, Mac OS X, and Windows) to support public release of the Visualization Environment for Rich Data Interpretation (VERDI) tool. Ms. Adams has installed the Sparse Matrix Operator Kernel Emissions (SMOKE) training software, data and ancillary software tools to a compute server on the Amazon Web Services (AWS) Elastic Compute Cloud (EC2) for an online SMOKE training course. Ms. Adams is experienced with using Python, QGIS, Panoply, IDV, VERDI, the Atmospheric Model Evaluation Tool (AMET), and Ncview to visualize and analyze NetCDF data from the CMAQ modeling system and comparing the results to data from the observational networks. She supports the CMAS Statistical and Graphical Analysis Tools training course by preparing, testing and porting input data and scripts for VERDI and AMET to the Virtual Computing Laboratory environment, preparing and delivering classroom lectures, and providing hands-on training support to students.
Payment Info
The two day course includes all training materials, the current Statistical and Graphical Analysis Tools Manual, access to experienced atmospheric modelers, snacks, and beverages. Payment is accepted with check, credit card, or purchase order. Note that you are asked to make the payment or initiate the payment process (e.g. by providing the purchase order number) at the time of registration. We will send you a receipt by email to confirm the receipt of the registration and payment. If you find later that you are unable to attend to the class after registration, notify the CMAS Center as soon as possible. Please see our Payment Info page for our refund policy.
Prerequisites
Operational knowledge of air quality modeling, and hands-on experience with Linux and shell scripts are required. Knowledge of R, Perl, and MySQL is helpful.
Contact Information
For more information on the Statistical and Graphical Analysis Tools training, please contact the CMAS help desk by email at cmas@unc.edu.
Community Modeling and Analysis System (CMAS)
General inquiries about the CMAS Center and questions about the web site should be directed to cmas@unc.edu