Community Modeling and Analysis System
R-LINE
A Research LINE-source dispersion model for near-surface releases
Features Downloaded system contains three components
Model Code
- Written in fortran, contains subroutines for metrological processes and source configurations.
- Includes "make" file to compile subroutines in gfortran and g95.
- Executables are included for Windows.
Test case data
- Input and output files from a demonstration run.
Evaluation Data
- Input and output files for multiple databases used for model development.
- Includes data from two tracer studies (Idaho Falls 2009 and CALTRANS Highway 99) and one real-world near-road field study (Raleigh 2006).
Updates
R-LINEv1.1 was a beta release to a select number of users through personal communications. From their feedback we added multiple components, including source grouping, source configurations, multiple lane specification, and multiple output options. Some of these new features are introduced as "beta options" in version 1.2. These options can be selected by the user in the control file.
Partners
- Institute for the Environment, UNC-Chapel Hill
- US EPA, Office of Research and Development, NERL, AMAD
- Professor Akula Venkatram, University of California, Riverside
Latest Version: R-LINE version 1.2
DOWNLOAD | DOCUMENTATION
Training
Hands-on R-LINE training will become available to the community in the near future.
Support
Online Resources
- Snyder et al. 2013: R-LINE: A line source dispersion model for near-surface releases, Atmospheric Environment.
- Venkatram et al. 2013: Re-formulation of plume spread for near-surface dispersion, Atmospheric Environment.
- Heist et al. 2013: Estimating near-road pollutant dispersion: A model inter-comparison, Transportation Research Part D.
- CMAS 2013 presentation by Arunachalam et al.: R-LINE: A Line Source Dispersion Model for Near-Surface Releases.
System Requirements
| O/S | Windows, Linux |
| Compilers | Tested with gfortran and g95; ifort, pgf90 |


The R-LINE model is a research grade dispersion model that is currently under development by EPA ORD for near-roadway assessments. R-LINE is a part of EPA ORD's ongoing evaluation of air quality impacts in the near-road environment. The research model is based upon a steady-state Gaussian formulation and is designed to simulate line type source emissions (e.g. mobile sources along roadways) by numerically integrating point source emissions. The current version of R-LINE ��� R-LINE 1.2 -- is formulated for near-surface releases, contains new (field study and wind tunnel based) formulations for the vertical and lateral dispersion rates, simulates low wind meander conditions, includes Monin-Obukhov similarity profiling of winds near the surface and selects plume-weighted winds for transport and dispersion calculations. The model utilizes the surface meteorology provided by the AERMET meteorological data preprocessor and includes user-friendly input requirements such as simplified road-link specifications. Model simulation with integrated point sources has been formulated with careful attention to appropriately simulate line source emissions for receptors very near the source line. This current version of the model is appropriate for flat roadways (no surrounding complexities); however, beta-option algorithms are included for simulating the near-source effects of complex roadway configurations (noise and vegetative barriers, depressed roadways, etc) and for simulating the line source emissions with an analytical approximation (rather than the numerical integration).
It should be noted that the R-LINE model is not appropriate for regulatory applications (e.g. NAAQS compliance and enforcement, NSR/PSD permitting, PM Hot-spot Conformity Analyses, SIP analysis, etc) because it has not undergone the extensive testing and comprehensive evaluation for such regulatory use. For guidance on dispersion models that are appropriate for regulatory use, see EPA's Guideline on AirQuality Models published as Appendix W to 40 CFR Part 51 (11/2/2005) and EPA's "Transportation Conformity Guidance for Quantitative Hot-spot Analyses in PM2.5 and PM10 Nonattainment and Maintenance Areas" (December 2010; EPA-420-B-10-040).
HISTORY of R-LINE
Growing concern about human exposure and related adverse health effects near roadways initiated an effort by the U.S. Environmental Protection Agency to reexamine the dispersion of mobile source related pollutants. These adverse effects, in combination with the fact that a significant portion of the population spending time at home, work or school within a few hundred meters of major roadways, support a need for dispersion modeling to capture the temporal and spatial variability of mobile source pollutants in the near-road environment. A research effort was initiated to design and conduct wind tunnel and field studies to evaluate pollutant transport and dispersion of near-surface releases which provided new and expanded databases for development and evaluation of improved line source algorithms. R-LINE is the initial modeling product of this development program. It is a research grade dispersion model that was primarily developed to support risk assessments and health studies related to near-road pollutants.
If you would like to suggest new features to be added to the R-LINE model, please send an email to rlinedev@unc.edu
C-LINE
The Community LINE Source Model (C-LINE) is a web-based model designed to inform the community user of local air quality impacts due to mobile-sources in their region of interest using a simplified modeling approach.
As has been established in near-road and near-source monitoring studies, busy roadways and large emission sources, respectively, may impact local air quality near the source. Reduced-form air quality modeling is a useful tool for examining what-if scenarios of changes in emissions, such as those due to changes in traffic volume, fleet mix, or vehicle speed. Examining various scenarios of air quality impacts in this way can identify potentially at-risk populations located near roadways, and the effects that a change in traffic activity may have on them.
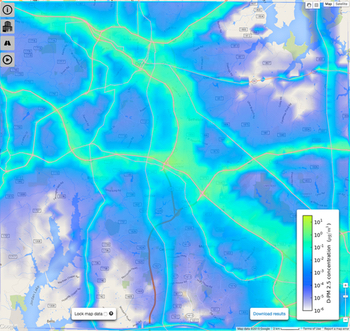
C-LINE computes dispersion of primary mobile source pollutants using meteorological conditions for the region of interest and computes air-quality concentrations corresponding to these selected conditions. The dispersion routines used are based on the analytical version of R-LINE described in Snyder, et. al. Atmos. Environ., 2013.
Specific emissions for each road-link are calculated by combining national database information on traffic volume (AADT) and fleet mix with emissions factors from EPA's MOVES-2010b. The user can modify the emissions for each road-link by changing the traffic composition, speed, and/or traffic volume. The air quality impact from a change in emissions due to changes in activity or fleet composition, or changes in representative meteorological conditions can be visually quantified for a select set of criteria pollutants and select mobile source air toxic (MSAT) species.
This web-based tool is currently capable of modeling any region of the United States. Additional information on the overall tool is available in Barzyk et. al., Environ. Model. Softw., 2015.
More About C-TOOLS
Community Modeling and Analysis System (CMAS)
General inquiries about the CMAS Center and questions about the web site should be directed to cmas@unc.edu